


Search for apartments in Chicago or check out apartments in other Chicago neighborhoods. Links will open on our partner site Redfin.com.
- Andersonville, Chicago apartments for rent
- Beverly, Chicago apartments for rent
- Bridgeport, Chicago apartments for rent
- Bronzeville, Chicago apartments for rent
- Bucktown, Chicago apartments for rent
- Edgewater, Chicago apartments for rent
- Garfield Ridge, Chicago apartments for rent
- Gold Coast, Chicago apartments for rent
- Hyde Park, Chicago apartments for rent
- Lake View, Chicago apartments for rent
- Lincoln Park, Chicago apartments for rent
- Logan Square, Chicago apartments for rent
- Ravenswood, Chicago apartments for rent
- River North, Chicago apartments for rent
- Rogers Park, Chicago apartments for rent
- Roscoe Village, Chicago apartments for rent
- South Loop, Chicago apartments for rent
- West Loop, Chicago apartments for rent
- West Town, Chicago apartments for rent
- Wicker Park, Chicago apartments for rent


 Bucktown - Arguably one of the busiest intersections in Chicago because of how popular this neighborhood is

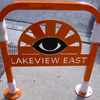 Brightly colored bike racks line the streets of this neighborhood.


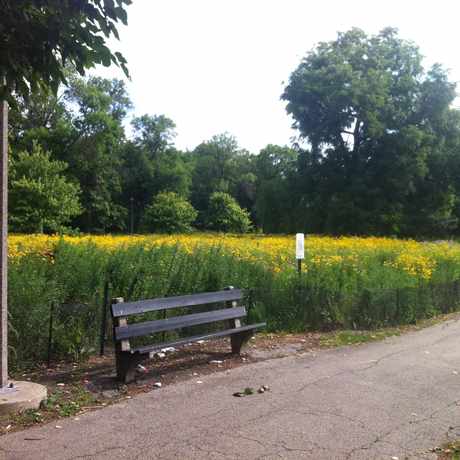
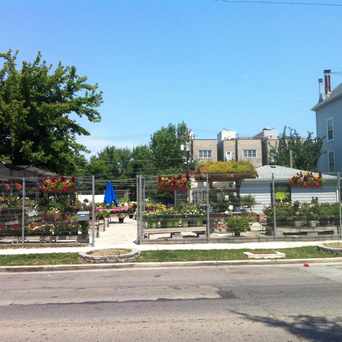
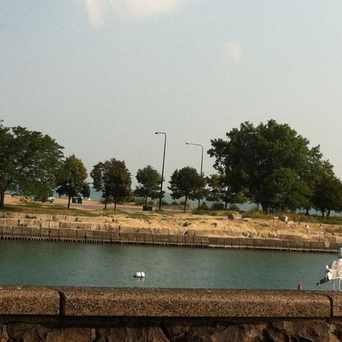
 #buenapark just on the other side of lakeshore drive this little park is the perfect place to relax. Fountains and well manicured gardens.


Alexander Price
on Wentworth & Cermak