Rank # | Name | Walk Score | Transit Score | Bike Score |
|---|---|---|---|---|
| 1 | Chambersburg | 87 | 50 | 54 |
| 2 | Hanover Academy | 81 | 59 | 59 |
| 3 | Franklin Park | 79 | 38 | 51 |
| 4 | Chestnut Park | 78 | 44 | 56 |
| 5 | North 25 | 77 | 48 | 64 |
| 6 | Villa Park | 76 | 38 | 50 |
| 7 | South Trenton | 75 | 49 | 61 |
| 8 | Battle Monument | 74 | 48 | 60 |
| 9 | Central West | 70 | 48 | 70 |
| 10 | Wilbur | 67 | 41 | 53 |
| 11 | North Trenton | 66 | 39 | 66 |
| 12 | Top Road | 65 | 34 | 64 |
| 13 | Pennington-Prospect | 58 | 40 | 54 |
| 14 | Stuyvesant-Prospect | 57 | 43 | 64 |
| 15 | East Trenton | 51 | 36 | 60 |
| 16 | West End | 50 | 40 | 60 |
| 17 | Hiltonia | 25 | 34 | 41 |

Some bike infrastructure.
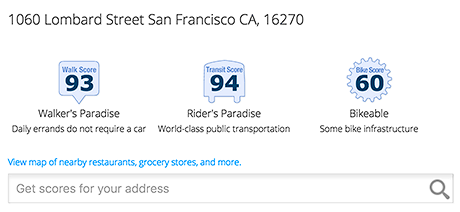
Add Walk Score, Bike Score, and Transit Score to your rental and for sale properties with the Walk Score Widget.

Build apps with Walk Score, public transit data, and commute and travel times via Walk Score APIs.

Use Walk Score data for real estate, public health, finance, and urban planning research and analysis.
If you are using a screen reader or having trouble reading this website, please call Walk Score customer service at (253) 256-1634.
© 2026 Walk Score


