Rank # | Name | Walk Score | Transit Score | Bike Score |
|---|---|---|---|---|
| 1 | Pine Brook | 77 | - | 53 |
| 2 | Bull's Head | 74 | - | 40 |
| 3 | Bellevue | 71 | - | 59 |
| 4 | The Plot | 66 | - | 47 |
| 5 | Hill Section | 65 | - | 41 |
| 6 | Greenridge | 63 | - | 44 |
| 7 | South Side | 63 | - | 31 |
| 8 | Hyde Park | 61 | - | 37 |
| 9 | Tripp's Park | 59 | - | 32 |
| 10 | Minooka | 54 | - | 35 |
| 11 | Providence | 49 | - | 32 |
| 12 | Keyser Valley | 27 | - | 34 |
| 13 | West Mountain | 12 | - | 14 |
| 14 | East Mountain | 11 | - | 9 |
There are about 231 restaurants, bars and coffee shops in Scranton.
People in Scranton can walk to an average of 1 restaurants, bars and coffee shops in 5 minutes.

Minimal bike infrastructure.
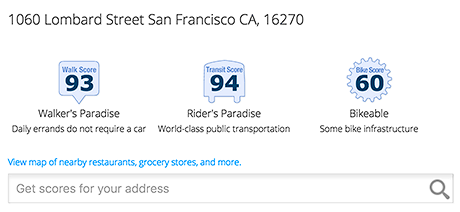
Add Walk Score, Bike Score, and Transit Score to your rental and for sale properties with the Walk Score Widget.

Build apps with Walk Score, public transit data, and commute and travel times via Walk Score APIs.

Use Walk Score data for real estate, public health, finance, and urban planning research and analysis.
If you are using a screen reader or having trouble reading this website, please call Walk Score customer service at (253) 256-1634.
© 2026 Walk Score


