Rank # | Name | Walk Score | Transit Score | Bike Score |
|---|---|---|---|---|
| 1 | Plumbridge | 59 | - | 51 |
| 2 | Kenwood | 53 | - | 44 |
| 3 | Junewood | 53 | - | 44 |
| 4 | Goldenridge | 47 | - | 44 |
| 5 | Highland Park | 47 | - | 45 |
| 6 | Indian Creek | 45 | - | 43 |
| 7 | Vermillion Hills | 44 | - | 40 |
| 8 | Quincy Hollow | 44 | - | 41 |
| 9 | Farmbrook | 44 | - | 43 |
| 10 | Stonybrook | 43 | - | 43 |
| 11 | Appletree Hill | 41 | - | 39 |
| 12 | Mill Creek | 39 | - | 40 |
| 13 | Red Cedar Hill | 38 | - | 42 |
| 14 | Birch Valley | 38 | - | 39 |
| 15 | Dogwood Hollow | 37 | - | 41 |
| 16 | Violetwood | 37 | - | 38 |
| 17 | Magnolia Hill | 36 | - | 36 |
| 18 | Blue Ridge | 34 | - | 37 |
| 19 | Holly Hill | 33 | - | 33 |
| 20 | Thornridge | 32 | - | 36 |
| 21 | Pinewood | 32 | - | 41 |
| 22 | Greenbrook | 29 | - | 41 |
| 23 | Willow-Wood | 29 | - | 39 |
| 24 | Forsythia Gate | 27 | - | 37 |
| 25 | Cobalt Ridge | 24 | - | 33 |
| 26 | Crabtree Hollow | 23 | - | 39 |
| 27 | Snowball Gate | 21 | - | 36 |
| 28 | North Park | 21 | - | 37 |
| 29 | Elderberry Pond | 20 | - | 36 |
| 30 | Oak Tree Hollow | 20 | - | 41 |
| 31 | Red Rose Gate | 18 | - | 29 |

Minimal bike infrastructure.
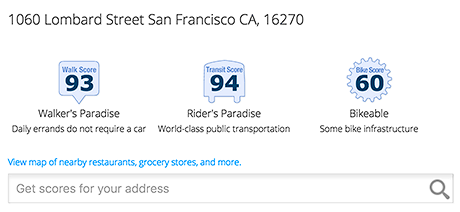
Add Walk Score, Bike Score, and Transit Score to your rental and for sale properties with the Walk Score Widget.

Build apps with Walk Score, public transit data, and commute and travel times via Walk Score APIs.

Use Walk Score data for real estate, public health, finance, and urban planning research and analysis.
If you are using a screen reader or having trouble reading this website, please call Walk Score customer service at (253) 256-1634.
© 2026 Walk Score


